
How KehatiKu Works: Occupancy Modelling
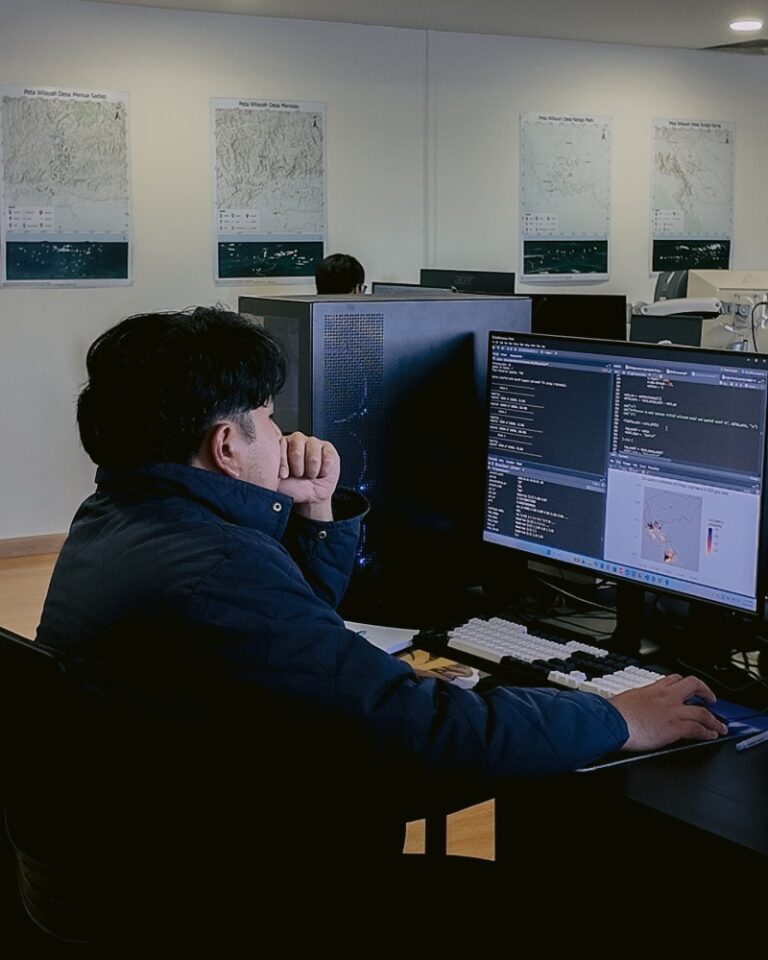
Central to the CAPAI application, and the programmes in which it is used, is its ability to translate observations into real-time data that can inform important management decisions and provide insights into species occupancy.
Turning these observations into meaningful data is the responsibility of our skilled in-house team. This forms the third step in the continuous cycle of observation, verification, analysis and incentive that underpins Borneo Futures’ citizen science-based methodologies.
Hafiz Norajame is the lead biostatistician at Borneo Futures. He leads occupancy analyses across our programmes, working alongside external experts and our newly appointed biostatistics assistant, Nurrun Nawwarah. I spoke to him about how this process works, using KehatiKu as an example.
The process begins with verified species records. However, species records alone are not enough to produce reliable occupancy estimates. Citizen science data is inherently opportunistic and unstructured, with considerable variation in where, when and how observations are made. These variations can introduce biases in sampling effort and species detection, which needs to be accounted for in the analysis.
To do this, Hafiz incorporates additional information, known as covariates, that may influence either the probability of detecting a species or the probability of its occurrence in an area.
Detection covariates relate to factors that may affect how likely a species is to be observed. These include the time of day, type of observations, weather conditions, field effort such as the number of species observations made in a particular area during a unique visit, and whether observations were recorded before or after a change in incentive, for example.
Occurrence covariates, meanwhile, relate to environmental and habitat characteristics that may influence where a species is found, such as distance from a road or village, elevation and land cover types. Accounting for both is essential to distinguish between a species being absent from an area and simply not being detected there.
Once these factors have been incorporated, the model can generate estimates of species occupancy across the study area, including individual 1 km² grid cells. Importantly, this also allows the model to estimate occupancy in grid cells where no observations have been recorded, providing a more complete picture of species distribution than the available records alone.
These analyses are conducted as and when they are needed, depending on requests from the team. This might be in response to a change in policy or circumstances, or to monitor changes in species distribution over time. However, before these estimates can be used to inform decisions, they need to be validated against independent data.
One way we do this is through standardised bird surveys, which provide a baseline against which our occupancy estimates can be tested. Between March and June 2026, we compared KehatiKu observations with structured survey data for nine bird species across up to 63 shared 1 km² grid cells.
The results were encouraging: although detection rates were higher in the structured surveys, occupancy estimates from the two data sources showed a strong positive correlation, with no statistically significant difference between them. This suggests that, despite the opportunistic nature of KehatiKu observations, the data can provide reliable estimates of species occupancy, provided that relevant source of variation in species detection are appropriately accounted in the occupancy models.
This ability to account for imperfect detection is one of the key strengths of occupancy modelling. As Hafiz explains, ‘In a standardised search, you might not always detect a species, but it doesn’t mean it isn’t there’. Rather than treating every absence of an observation as evidence that a species is absent, occupancy modelling accounts for the possibility that it was simply overlooked.
There are, however, limitations to what occupancy modelling can tell us. Most importantly, it estimates species distribution rather than population size or abundance. ‘The main limitation is that you can’t tell abundance. This is not the question that occupancy modelling aims to investigate.’
The reliability of the models also depends on the amount of data available. When records for a particular species are very limited, the models may perform poorly, making it difficult to produce precise and reliable estimates. This is particularly challenging when working with some critically endangered species, which may be rarely observed. More complex approaches, such as multi-species occupancy modelling, can help address this limitation by drawing on information from multiple species, allowing estimates for species with low records to benefit from information available for other species.
The introduction of the CAPAI application is expected to help improve this process further. Hafiz believes that the improved quality of observations and increased ease of use will allow the team to work with more complete and accurate datasets, ultimately strengthening the reliability of his analyses.
Ultimately, while estimating abundance using opportunistic citizen science data remains extremely challenging, occupancy modelling allows us to make much greater use of the observations we do have. Unlike standardised surveys, which usually focus on specific locations and sampling periods KehatiKu generates a continuous stream of observations across the landscape. By translating these records into estimates of species distribution, our models can provide valuable insights for land management and policy, helping us better understand where species occur and how their distributions change over time.
In the next edition of this series, I speak to Safwanah Said and Muiz Wafiy from the geospatial team, who explain how they translate the data generated through Hafiz’s analyses into visual tools for research and policy.